Freedom's StockAnalyzer

May 31, 2025 — by Lisa Moratz
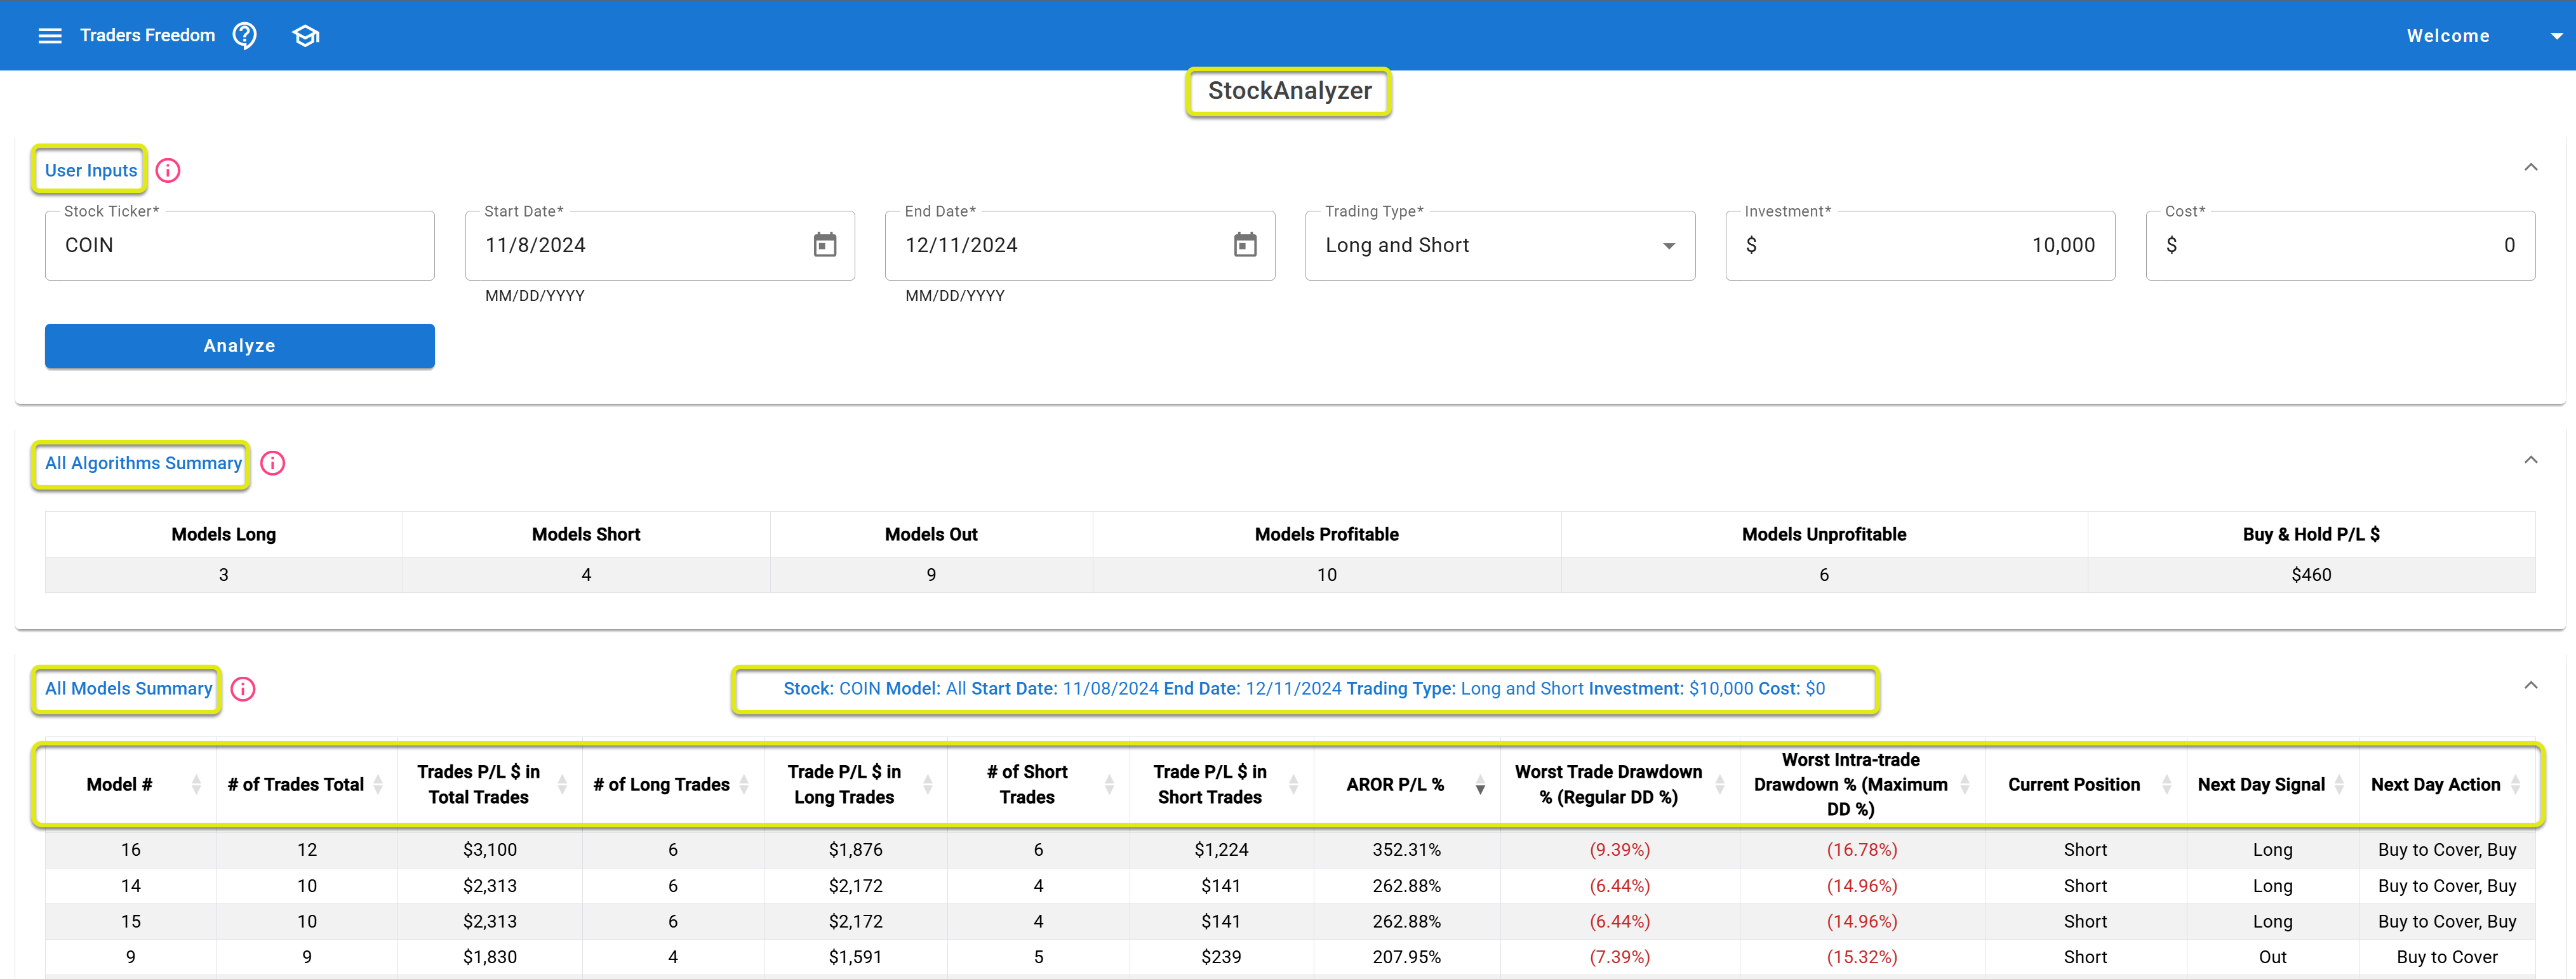
Freedom gives you one simple stock trading signal for tomorrow - for any stock you pick.
Each evening after the markets close, you'll get a new trade signals for all 11,000-plus stocks & ETFs that trade regularly on the NYSE & NASDAQ stock exchanges.
Freedom analyzes the historical trading patterns of virtually every U.S. stock & ETF and generates a new, proprietary trade signal for each one for tomorrow.
No guessing. No hype. Just smart analytics. Trade signals - based solely on your stock's actual historical daily price and volume data from it's last 2 years of trading.
And all you need to do is easy: login for 10 minutes each evening to tradersfreedom.com, once a day, after 8:00 P.M. EST, and check tomorrow's simple trade signal for any stock you pick - more than 12 hours before the markets reopen for the next trading day.